Archive · Capture date shown. Restored from a saved copy of this website. References, services, and opinions reflect the time it was written. View the archived source.
Custom Reports are not covered in the Google Analytics IQ lessons but it is part of the IQ exam. These reports are just saved customized metrics and dimensions that you can save in the “Customization” tab for easy referencing.
How to Create a Custom Report
The easiest and fastest way to create a custom report is to start off with a standard report and then customize from there. This is because metrics and dimensions are already loaded and you can just add or take away from the existing report rather than starting from scratch. You can do this by pulling up a standard report in the desired area and then click the “Customize” button in the top next to the “Advanced Segments” button.
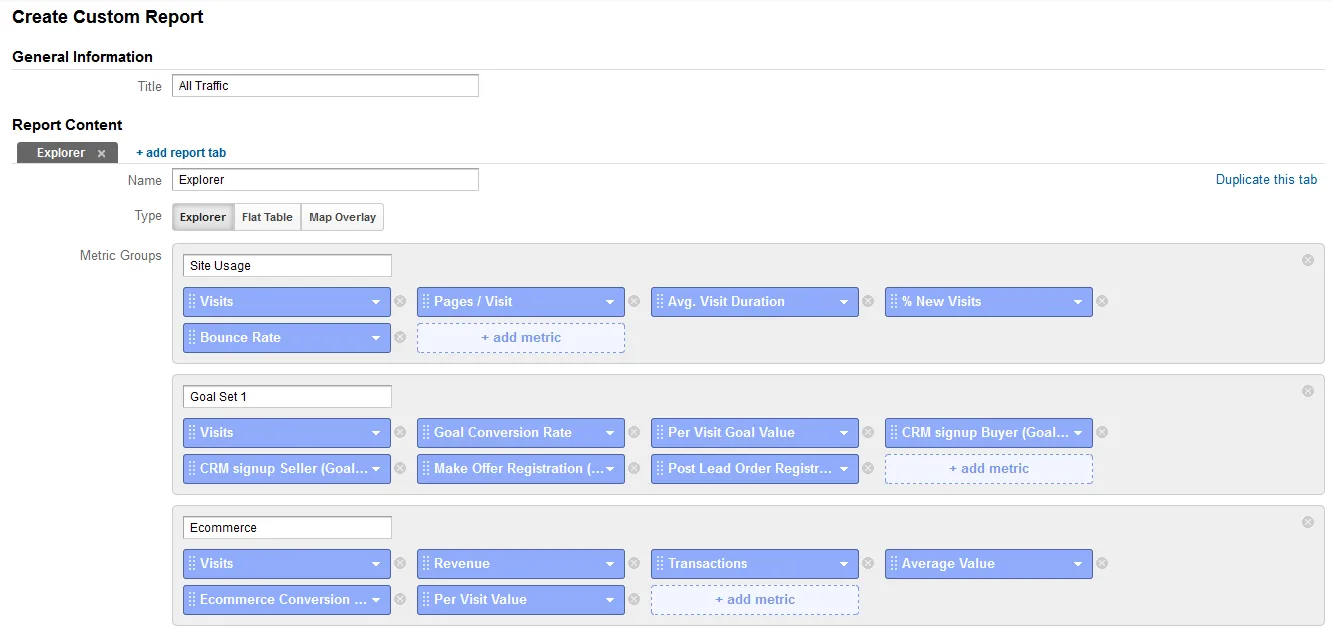
This will open the standard report in the “Customization” tab where you can edit the metrics and dimensions. The image below shows some of the metrics used for the Traffic Sources> Sources> All Traffic report. Here you can add and remove metrics and dimensions to slice and dice the data to see specialized reports. There are several metrics and dimensions that you can choose from by searching or browsing through the dropdown option.
Import & Share Pre-Made Custom Reports
After you setup custom reports in your Google Analytics account you can then share them to be imported into other accounts and profiles. Below are some very useful pre-made custom reports that you can use. First login to Google Analytics if you are not already and then just click on one of the links below to have the report imported directly into a profile of your choice.
1. Content Efficiency Analysis Custom Report– This report puts all important content factors in one report. This will show you what type of content (text, videos, pictures, etc.) performs the best? What content delivers the conversions and What content is the most engaging?
In this report you will see the following metrics…
- Page Titles
- Entrances
- Unique Visitors
- Bounces
- PageViews
- Avg. Time on Page
- Per Visit Goal Value
- Goal Completion
2. Keyword Analysis Custom Report– This is a good SEO report. Compare goals and other conversions to keywords to see which keywords are performing the best.
Tab 1: Targeting…
- Unique Visitors
- Goal Completions
- Goal Conversion Rate
- Avg. Page Load Time (sec)
Tab 2: Engagement…
- Unique PageViews
- Pages/Visit
- Avg. Time on Page
- Bounce Rate
- Percentage Exit
- Goal Conversion Rate
3. Link Analysis Custom Report– Here you can analyze your referring links to see which ones perform the best using the following metrics…
- Source
- Landing Page
- Visits
- Goal Completions
- Pages/Visit
- Bounce Rate
- Percentage New Visits
4. PPC Keywords Custom Report– Check the performance of paid keyword searches and the ROI for each keyword. You can easily see what keywords are worth paying for and how much should you can pay and still get a good ROI. This report compares PPC campaigns using the following metrics…
- Visits
- CPC
- Goal Completions
- Cost per Conversion
5. Social Media Custom Report– See which social media networks perform the best for your site in terms of social signals (actions), goals, conversions and value. This report uses the following metrics…
- Visits
- Social Actions
- Goal Completions
- Goal Conversion Rate
- Goal Value
6. E-commerce Traffic Custom Report– Check to see which of your incoming traffic channels produce the highest engagement and revenue. The E-commerce reports the following metrics…
- Visits
- Percentage New Visits
- Bounce Rate
- Pages/Visit
- Revenue
- Average Value
- Per Visit Value
7. Browser Custom Report– This report will help to check cross browser compatibility for your site and allow you to see what effect browser technology has on the following metrics…
- Visits
- Revenue
- Bounce Rate
- % Exits
- Unique Purchases